Title: Modelling and Control of Production Systems based on Observed Inter-event Times: An Analytical and Empirical Investigation
Technological advances allow manufacturers to collect and access data from a production system more easily and effectively. The objective of data collection is deploying the collected data in developing decision support systems for performance evaluation, problem identification, and production control. As a result, data-driven modeling and control methods are now considered as enabling technologies to address the technology challenges for implementing factory of the future.
Over the years, manufacturers have become more successful in efficient control of their supply chain and deploying new methodologies that match supply with demand by adopting data-driven methodologies. The collected data is used for different purposes from predictive maintenance to performance evaluation, production control, to supply chain optimization. The supply chain efficiency can be further improved by using the recent development in data analytics, optimization, and machine learning methodologies. Manufacturing systems are affected by various types of uncertainty in their supply chain. Effective control of the manufacturing system and supply chain requires a thorough understanding of the effects of these uncertainties in strategic decision making related to demand fulfillment and production planning. Strategic decisions are based on the demand forecasting that needs to be coordinated with the production unit to account for long lead times of the products.
There is a lack of documented, comprehensive, empirical research on manufacturing systems that uses detailed data from shop-floor to evaluate performance and optimize the manufacturing systems efficiency. One of the main research questions that arises in the study of a digital manufacturing systems is: How can the collected data from manufacturing systems be characterized and modeled for analytical methods and simulation in the most possible accurate way? The answer to the first question gives rise to the following questions: How can the collected data from the shop-floor be used in efficient control and design of manufacturing systems? and How can the collected data be used directly in identifying the most important features, evaluating the performance, and predicting the performance measures? The goal of this dissertation is to investigate the answers to these questions. Each question is explained in further detail in the following subsections. I use stochastic models and the product flow data of the Reutlingen semiconductor manufacturing system of the Robert Bosch Company in investigating these questions, empirically and analytically. The inter-event data used in the empirical analysis consists of the product movement of every product processed in the 200 mm wafer fabrication. The raw dataset consists of 17,223,658 rows of inter-event data which contains the data related to almost thousands of unique products.
How can the collected data be used from the shop-floor in efficient control and design of manufacturing systems?
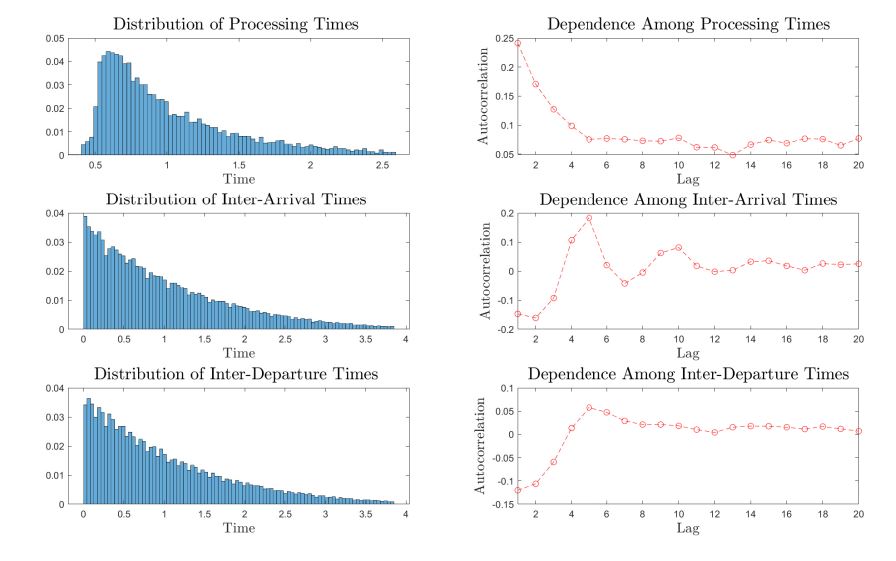
The usual approach in the study of the manufacturing systems has been modelling the complex reality with a simple queuing model that represents the complex reality. The parameters of the adopted models, such as the rate of exponential distribution for modeling the processing times, are estimated by using the collected inter-event data. Shanthikumar, Ding, and Zhang (2007) state that the current queuing models for manufacturing systems ignore some important characteristics of the inter-event times data such as the correlation between the inter-event times. My empirical analysis of the statistical properties of inter-event times shows that the inter-event times of a production system such as the inter-arrival and processing times may demonstrate a significant dependency between themselves. The following figure demonstrates the empirical distribution and autocorrelation of the inter-event times of a particular equipment at the Reutlingen plant. Such a dependency has been ignored in most of the analytical studies in control and design of production systems. Hence, the questions that arise are: How can we model the dependency between the inter-event times in the manufacturing systems?, and How does the dependency between the inter-event times impact the optimal control of the system?
I investigated the answer to the question "How can we model the dependency between the inter-event times in the manufacturing systems?" in my master's thesis. There, I showed how the inter-event data collected from a manufacturing system can be used to build a Markovian Arrival Processes (MAP) model that captures correlation in the inter-event times. The obtained MAP model can then be used to control the production system in an effective way. I also presented a comprehensive review on MAP modeling and MAP fitting methods applicable to manufacturing systems. Then, I presented results on the effectiveness of these fitting methods and discussed how the collected inter-event data can be used to represent the flow dynamics of a production system accurately.
In my PhD thesis, I answer the question "How does the dependency between the inter-event times impact the optimal control of the system?" by investigating the following questions:
- How does ignoring the dependency between the inter-event times impact the control of a production system controlled by single-threshold policy?
- What is the optimal control policy of a production system with correlated inter-arrival and processing times?
- How does the single-threshold policy perform in comparison to the optimal policy?
Impact of Correlation in Inter-Event Times on the Performance Measures of Production Systems Controlled by Single-Threshold Policy
A chapter of my thesis analyzes a manufacturing system that is controlled by using a single-threshold policy to investigate the impact of capturing the flow dynamics accurately on the performance of a production control system. I study the impact of correlation in inter-event times on the optimal single-threshold level of the system numerically by employing the structural properties of the MAP. I show that ignoring correlated arrival or service process can lead to overestimation of the optimal threshold level for negatively correlated processes, and underestimation of the optimal threshold level for the positively correlated processes. In other words, I show that ignoring autocorrelation of a correlated inter-event times results in setting the base-stock level at a higher or lower level in comparison to the optimal threshold level. I conclude that MAPs can be used to develop data-driven models and control manufacturing systems more effectively by using the shop-floor inter-event data. This study contributes to the literature by presenting results that show the impact of correlation in the inter-event times on the production control for the first time in the literature.
Optimal Control of Production-Inventory Systems with Correlated Demand Inter-Arrival and Processing Time
In order to answer the question "How can we optimally control a production system with correlated inter-event times?", I investigate the optimal control policy of a production system with correlated inter-arrival and service times. I consider a production/inventory control problem with correlated demand arrival and service process modeled as Markovian arrival processes. The objective of the control problem is minimizing the expected average cost of the system in steady-state by controlling when to produce a new product. I show that the optimal control policy of a fully observable system is a state-dependent threshold policy. I compare the performance of the optimal policy with that of the optimal single-threshold or the base-stock policy where the threshold level is set independent of the state of the system. I evaluate the performance measures of the system controlled by the optimal state-dependent base-stock policy by using a Matrix Geometric method. I investigate how the autocorrelation of the arrival and service process impacts the optimal threshold levels of the system. The numerical analysis demonstrates that the state-independent policy performs near-optimal for the negatively correlated processes. However, when the inter-event times are positively correlated, using a state-dependent threshold policy improves the performance. I consider showing the optimality of the state-dependent base-stock policies for production/inventory systems with inter-arrival and service times that are modeled as MAPs, evaluating the performance of the single-threshold policy in controlling the system, and impact of correlation of the inter-event times on the optimal control levels as the main contributions of this study.
How can the collected data be used directly in identifying the most important features, evaluating the performance, and predicting the performance measures?
I use the product movement data from the semiconductor manufacturing system of the Robert Bosch Company in Reutlingen, Germany to investigate the answers to this question. This dataset allows us to perform exploratory data analysis (EDA) on the main features that are impacting the main performance metrics of the semiconductor wafer fabrication in different levels of detail.
Semiconductor manufacturing systems are the most complex manufacturing systems in existence. The most important step of the semiconductor manufacturing is the wafer fabrication which accounts for more than 75% of the total production time of the products. The capital intensive machines in the wafer fabrication necessitates the same machines to be used for similar processing steps resulting in a production network rather than assembly line type of a system. Hence, a queuing-network view of product flow is necessary for studying the performance of the wafer fabrication. The aim of this study is to identify the important features that are impacting the main performance metrics of the wafer fabrication such as the total cycle times of the products in different levels of detail.
The EDA reveals that half of the products spend more than 70% of their time inside wafer fabrication waiting to be processed. The waiting times of the products is impacted by a different variety of factors from different product types to the dispatching rules used for assigning products into machines. The analysis reveals that some of the layers (subset of different equipment) in the product route may contribute significantly more than others to the waiting and eventually the total cycle times of the products. The layer level analysis suggests that the production manager may need pay extra attention to the bottleneck recipes inside the layers. The machine level EDA on the statistical properties of the inter-event times shows that processing times demonstrate a significant amount of positive dependency between themselves. Inter-arrival and inter-departure times may also demonstrate a significant correlation between themselves as well.
This chapter contributes to the literature by empirically investigating the most important features that are impacting the performance metrics and control of the system. My empirical findings based on the product flow data of several hundreds of machines reveal that significant amount of correlation may exist between the inter-event times in the machine level which has usually been ignored in the literature. In addition, EDA shows that major part of the products cycle times consists of the waiting times of the products. Based on the EDA results, I propose possible research directions that needs to be investigated to decrease the waiting and eventually total cycle times of the products. In particular, I demonstrate that there are two main factors that impact the variability of the total cycle times through better due-date assignment and product release decisions. Due-date assignment impacts the total cycle times of the products through dispatching rules and scheduling of the lots on the machines. Different set of parameters, such as the priority and due-dates of the lots, which are being used for optimizing the flow of products inside the wafer fabrication are set based on the predictions of the total cycle times of products. Therefore, developing models that are able to predict delivery dates and remaining production times based on the observed data and current state of the wafer fabrication with acceptable accuracy is quite important.
I use the lot-trace data from the wafer fabrication to prepare a dataset for predicting the total cycle times of the products. The dataset consists of two sets of features that can explain the total cycle time of the products in the wafer fabrication, namely the product-related and system-state related features. The product-related features capture different product attributes such as the product type, the production route of the product and the distribution of the processing times on the product route. On the other hand, the system-state related features capture the state of the system upon arrival of the lot. I use this dataset to find prediction methods that are able to predict the cycle times of the lots with acceptable accuracy. In particular, rolling average based and learning based methods are adopted. The rolling average based methods predict the cycle times of the products by using the cycle times of the previous products that have completed all or some part of their processing. On the other hand, learning-based methods identify the parameters of a certain model by minimizing a specified objective function such as sum of squared errors. They predict the cycle times of the products by using the product and system state related features as independent variable and cycle times of the products as dependent variable.
Other important factors that impacts the variability of total waiting and cycle times are the product-release decisions and production system's WIP level balance in different production areas. Further research is required to understand the impact of release of different types of new products to the system. New stream of research in this area integrates machine learning models into the simulation models to build meta-models for predicting the cycle time–throughput (CT-TP) curves that can be used for making release decisions. A possible research direction is to replace the costly simulation models with queuing systems such as infinite server queues to approximate the CT-TP curves.
The imbalanced ratio of the waiting to processing times in different areas of the wafer fabrication suggests a possible inefficiency in controlling the wafer fabrication. The new products are usually released into the wafer fabrication based on a push strategy to maximize the utilization of the capital intensive machines. Releasing the products into wafer fabrication without taking into account its impact on the waiting times in front different sets of resources may lead to exponential increase in the waiting times and their variance. In wafer fabrication products are assigned to machines by using local optimizers such as dispatching rules. There is a need for further research that balances the WIP levels and consequently the waiting times of the products in front of different set of resources. A global optimizer that is integrated to the local optimizers and takes into account the current state of different set of resources is needed to optimize the WIP levels.
The analytical and empirical results presented in this dissertation show that the effective use of the collected data from a manufacturing system enables controlling the manufacturing system effectively and predicting its main performance measures accurately.
Acknowledgement
The findings of my thesis has been made possible through the participation of Koc University in the Productive 4.0 project and the corresponding TUBITAK project. My one year PhD visit at Bosch Center for Artificial Intelligence has also been another contributing factor. The visiting position in Stuttgart, Germany enabled me to visit the wafer fabrication more frequently and discuss the related issues with the experts in understanding and cleansing the data and integrating different datasets.