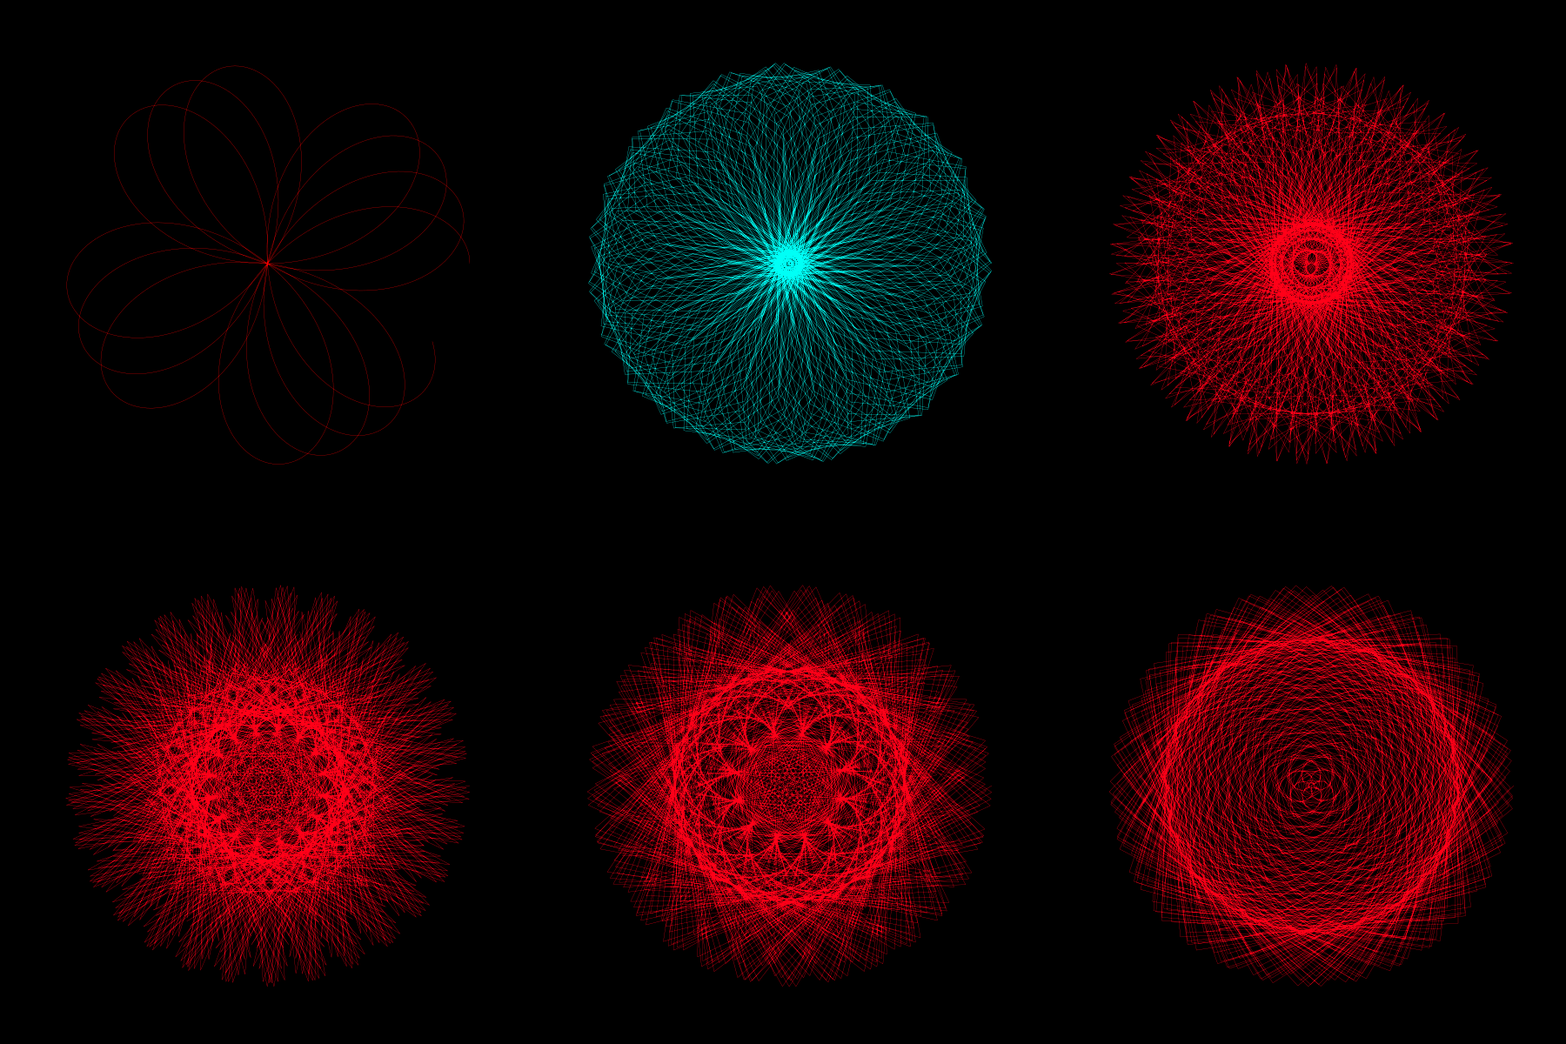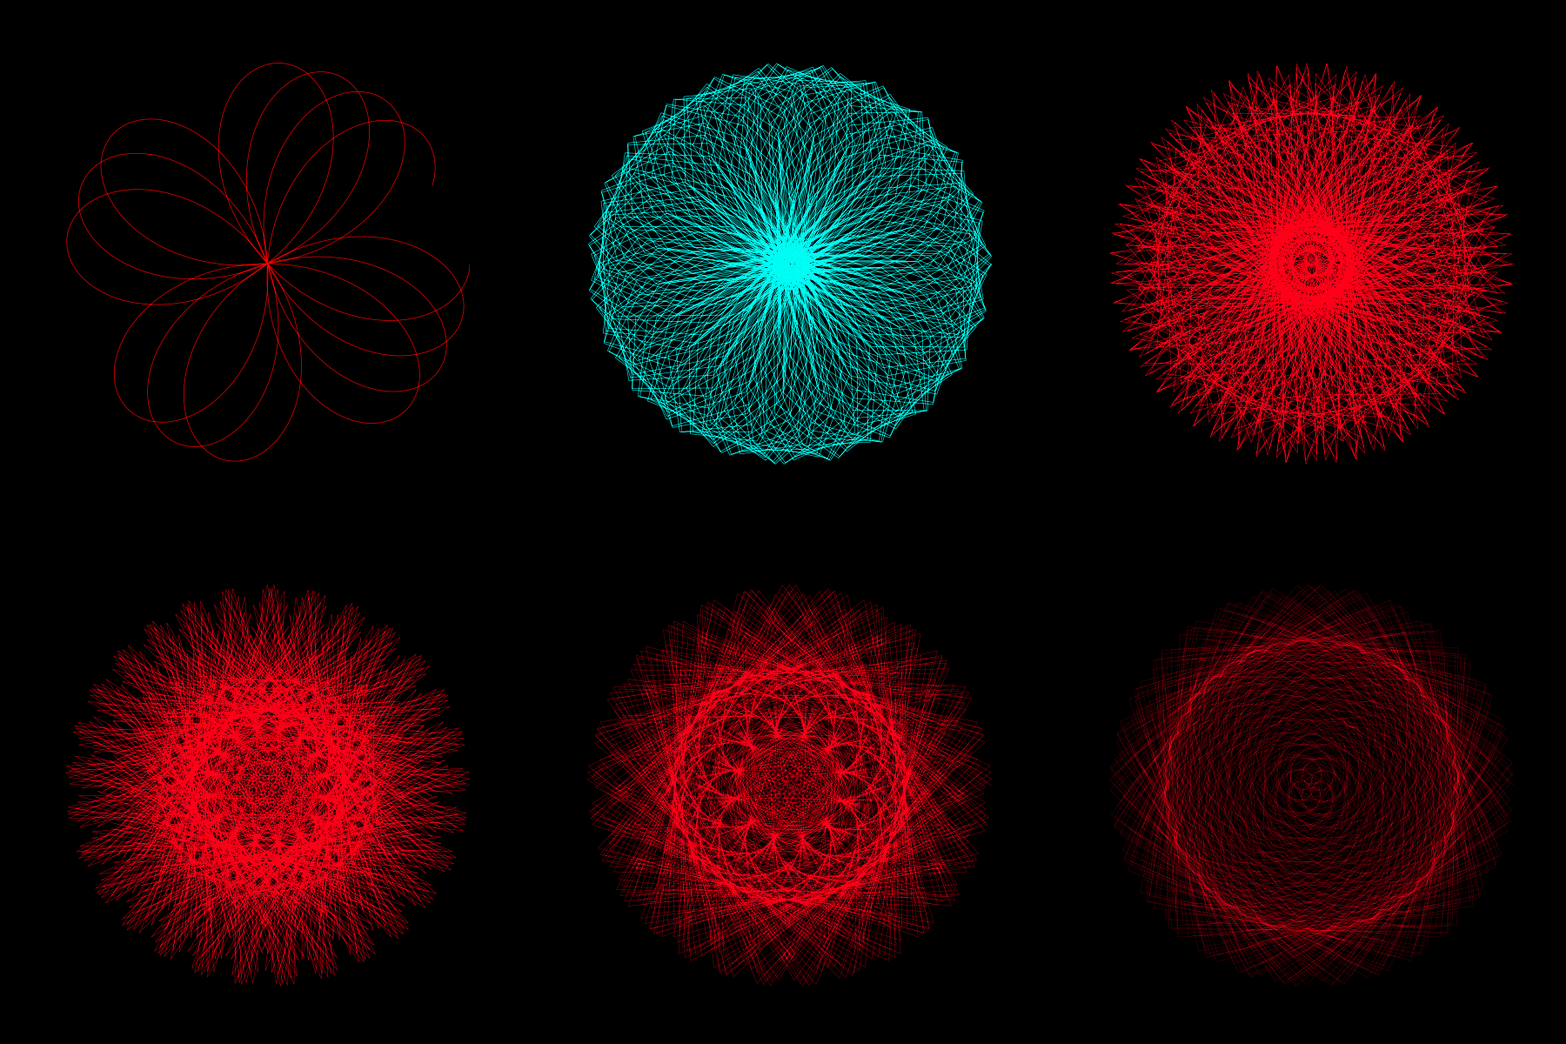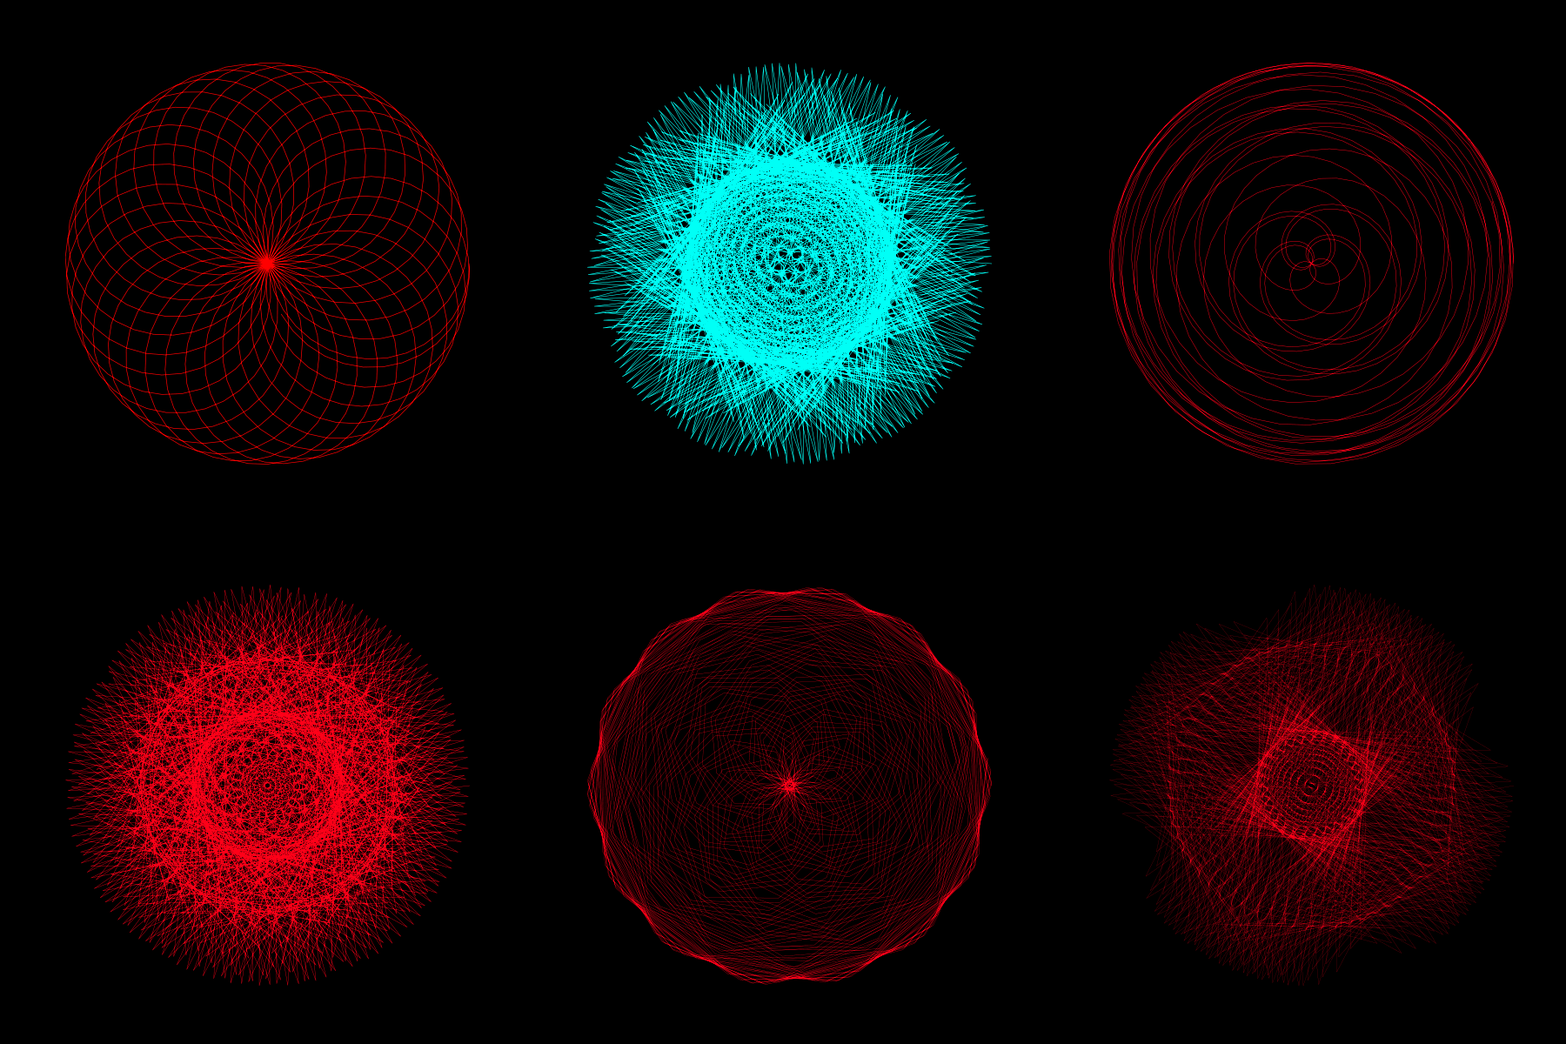
In the quest to understand the nature of π (pi), visualizations can offer intuitive insights into its irrationality. A captivating way to explore π is through animated visualizations that bring out the essence of its continuous and non-repeating nature. In this post, we delve into a beautiful geometric animation crafted in Python, which provides a visual representation of π's irrationality.
Let's start by understanding the core function that drives our visualization:
z = np.exp(1j*theta) + np.exp(1j*np.pi*theta)Here, z is a complex number that changes with theta, a variable that ranges from 0 to 2π, making a full circle in the complex plane. The function consists of two parts:
- \( e^{i\theta} \): This is the polar form of a complex number, representing a point on the unit circle in the complex plane.
- \( e^{i\pi\theta} \): This term brings π into the mix, adding a twist to the simple circular motion described by the first term.
By adding these two terms together, we create a complex function that traces a unique path in the complex plane as theta varies. This path gradually fills a circle, showcasing the continuous and non-repeating nature of π.
Now, let's create an animation using Python's Matplotlib library to visualize this function over time:
import matplotlib.pyplot as plt
import numpy as np
from matplotlib.animation import FuncAnimation
from IPython.display import HTML
import matplotlib.colors as mcolors

# Create a figure and axis
fig, ax = plt.subplots(figsize=(6, 6))
ax.axis('off')
ax.set_xlim([-2, 2])
ax.set_ylim([-2, 2])
ax.set_facecolor('black')
fig.set_facecolor('black')

# Initialize the plot with an empty line
line, = ax.plot([], [], lw=2)

# Define the initialization function
def init():
    line.set_data([], [])
    return line,

# Get a color map
color_map = plt.get_cmap("rainbow")

# Define the animation function
def animate(i):
    theta = np.linspace(0, 2*np.pi*(i+1), 1000)
    z = np.exp(1j*theta) + np.exp(1j*np.pi*theta)
    x = np.real(z)
    y = np.imag(z)
    line.set_data(x, y)
    line.set_color(color_map(i/30))
    return line,

# Create the animation
ani = FuncAnimation(fig, animate, init_func=init, frames=30, interval=200, blit=True)

# Display the animation as HTML
html_output = HTML(ani.to_jshtml())

# Close the figure
plt.close(fig)

# Display the HTML output
html_output
This code snippet generates an animated visualization where the function z traces a path in the complex plane as theta increases, gradually filling a circle with a dynamically changing color.

Furthermore, this animation can be extended to explore the effects of different coefficients for the exponential terms. By tweaking the coefficients a and b in the function \( z = e^{ai\theta} + e^{bi\pi\theta} \), you can generate a variety of mesmerizing animations, each offering a unique visual exploration of π's mysterious nature.

Embark on this visual journey to deepen your appreciation for the enigmatic number π, and discover the myriad patterns awaiting revelation through the lens of animation.